Connectivity Tool User Manual
Contents
You may also find, guidance on applying the Connectivity Tool, Interpreting connectivity scores or understanding the data useful.
Introduction
All terms in bold are defined in the glossary at the bottom of this page.
Connectivity Tool is the publicly accessible, scores-only view of the Department for Transport’s national connectivity metric. It shows how well places are connected to everyday destinations by walking, cycling and public transport.
For further queries on how to use the Connectivity Tool, please contact connectivity@dft.gov.uk.
Using the map
The map is Connectivity Tool's main interface.
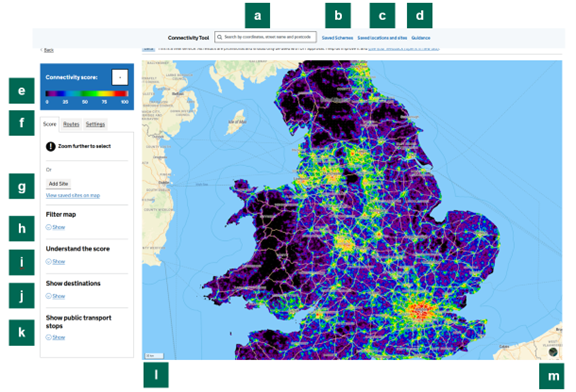
Figure 1: The main map view
Navigating Around
When you enter connectivity Tool for the first time, the map will display the national overall heat map for England and Wales.
The guidance can be accessed directly from the map view by clicking ‘Guidance’ on the top bar of the screen (Figure 1, b).
To search for a location (grid reference, place name, street name or postcode), type the location in the search box (Figure 1, a). Alternatively, zoom in by scrolling on your trackpad or mouse. The scale bar (Figure 1, e) at the bottom left corner of the map displays how far you have zoomed in.
Alternatively, you can pan/zoom; + / – controls are top-right (Figure 1, c).
Once you have zoomed in far enough, you will be able to move your cursor across the map and read the scores for each 100m x 100m grid square in the top left corner of the screen (Figure 1, i). Click anywhere on the map to select that location tile.
Additional Functions (Figure 1, d):
- The Info (bottom, “i” icon): opens attributions/data-source info.
- To use the measuring tool, select the icon to start; click along a path to measure distance; double-click to finish.
Customising the map
To view a satellite map, press the satellite view icon (Figure 1, d). The satellite view does not currently allow you to overlay or select a location. To view connectivity scores or select a location, switch back to the score view by pressing the same icon (Figure 1, d) again.
To change the transparency/opacity of the scores on the map, click the ‘Settings’ tab (Figure 1, h). This will take you to the ‘Settings’ sidebar (Figure 2). You can then enter an opacity value by entering a specific number in the box or by moving the slider (Figure 2, a). 0% is fully transparent (only the background map is visible; no scores are visible) while 100% is fully opaque (no background map is visible; only scores are visible).
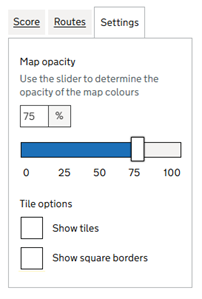
Figure 2: The ‘Settings’ sidebar
To add or remove tile colour fills or borders, click the ‘Settings’ tab (Figure 1, h) to open the Settings sidebar (Figure 2). To control the fills, tick or untick the ‘Show tiles’ box; when unticked, only the tile borders are shown. To control the borders, tick or untick the ‘Show square borders’ box; when unticked, only the tile colours are shown.
If you untick both the ‘Show tiles’ (Figure 2, b) and ‘Show square borders’ (Figure 2, c), no scores will be displayed on the map. However, you can still hover over grid squares, see the changes in score (Figure 1, i), and select a location.
Filtering the map
To change the view on the map (e.g. to select specific modes of transport, types of destination, or local authority areas), click ‘Show’ under the ‘Filter map’ heading (Figure 1, g). This will open the ‘Filter map’ menu (Figure 3).
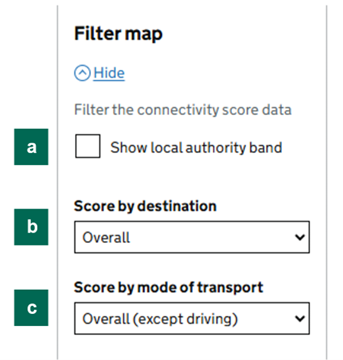
Figure 3: The ‘Filter map’ menu
To select a local authority or combined authority area, click ‘Show local authority view’ (Figure 3, a) and use the drop-down menu to search for the local authority you wish to view. You can also search by typing the name of the authority in the field. Once selected the map will centre on the local authority area and show connectivity scores for that area only.
To understand relative connectivity within the local authority area select ‘Show authority band’ (Figure 3, b). This will show a ‘Local authority band’ from A to J underneath the overall connectivity score. This ranks all grid squares in the local authority area into ten bands. These ten bands are also shown on the map in ten colours. In some instances, especially in smaller local authorities, not all bands will show on the map. This is because the range of scores within that local authority is too narrow to divide into ten roughly even bands.
To view scores for just one type of destination (i.e. shopping, education, employment, residential, healthcare, leisure), select the ‘Score by destination’ dropdown menu (Figure 3, c). Then select your desired type of destination.
To view scores for just one mode of transport (i.e. public transport, walk, cycling or driving), select the ‘Score by mode of transport’ dropdown menu (Figure 3, d). Then select your desired mode of transport.
You can also combine each mode of transport with each type of destination and view the score for that combination of mode and destination on that map.
Viewing public transport stops
To view the destinations on which a location’s connectivity score is based, click ‘Show’ under the ‘Show destinations’ heading (Figure 1, b).
This allows you to view destinations for education, leisure and community, health, and shopping facilities. It is not possible to view workplaces or dwellings in this view as these are calculated differently.
Click on any destination to view its name (for schools and shops) and subtype of destination. Examples of subtypes of destination include primary (for schools) and supermarket (for shops).
To view public transport stops on the map, click ‘Show’ under the ‘Show public transport stops’ heading (Figure 1, f).
Glossary
More information on how Connectivity scores are calculated is included in the methodology.
- Local authority band: A method of better understanding score differences across a local or combined authority area, by dividing each local authority into ten bands from A (high scoring) to J (low scoring). One or more scores is grouped into each band. Each band represents approximately one-tenth of that local authority or combined authority’s area.
- Destination: A destination is a place which counts for the calculation of connectivity scores, such as a shop, a primary school or a dwelling. Destinations fall into one of six categories: education, health, leisure, residential, shopping, and workplaces. More information on what each category is made up of is included in the methodology.
- Grid square: The 100m x 100m squares which are shown on the Connectivity Tool map. Each is assigned a ‘tile’, which overlays a colour onto the square.
- Location: Any single point (one-dimensional) on the map. Each location falls within a grid square.
- Mode of transport: Connectivity scores are calculated for four modes of transport: walking, cycling, public transport, and driving.
- Overall: The overall score is the standard connectivity score. The overall score includes all destinations, and all modes of transport except driving.
- Public transport: All forms of public transport are grouped into one mode for the purposes of the Connectivity Tool. This includes buses (including some demand-responsive services), coaches, trains, ferries, light rail, trams and metro systems.
- Score: A number from 0 to 100, reflecting the proportion of the highest-scoring location in England and Wales.
- Sidebar: The options menu to the left of the map.
- Stop: The existing network of public transport stops.
- Tile: The coloured overlay on top of a grid square.